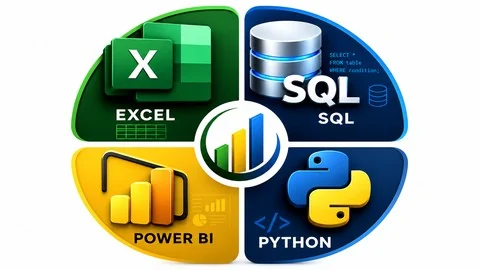
Discover essential data analytics skills, from Excel and SQL to Python and Power BI, with practical examples for aspiring analysts in Nairobi.
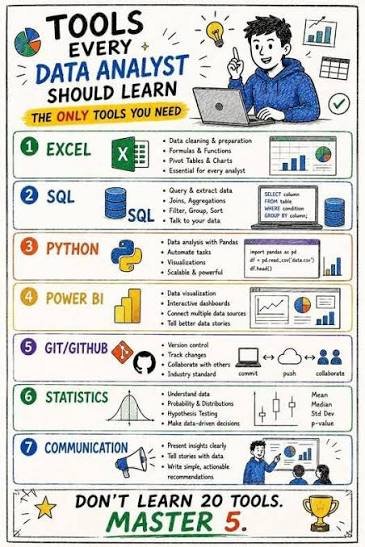
Data Science Training in Nairobi: Learn the Tools Used by Data Analysts
Do you enjoy working with numbers, identifying patterns or finding answers to business questions? Data analytics could be a suitable technology pathway for you.
When searching for data science training in Nairobi, it is important to understand the tools used to collect, organise, analyse and communicate information.
A capable data analyst does more than create charts. The analyst must understand the question, check data quality, choose appropriate methods and explain findings in a way that supports decisions.
At Dazu School of Tech, prospective learners in Nairobi and Thika can enquire about technology courses that support their professional development.
1. Excel for Data Analysis
Excel is often a practical starting point because it allows learners to work with structured data without immediately needing advanced programming.
Important skills include:
Sorting and filtering records.
Using formulas and conditional functions.
Cleaning inconsistent information.
Creating pivot tables.
Applying lookup functions.
Building charts and summary reports.
Example: Analysing a clothing shop
Imagine a Nairobi clothing business has recorded 2,000 transactions. The owner wants to know which products sell best and which months generate the highest revenue.
Using Excel, you could summarise sales by product, compare monthly revenue and calculate average transaction values.
The results could help the owner plan stock purchases and evaluate promotional campaigns.
2. SQL for Working with Databases
SQL stands for Structured Query Language. It is used to retrieve and manage information stored in relational databases.
An analyst may use SQL to filter records, group transactions, combine tables and calculate totals.
For example, a business might store customer details in one table and sales transactions in another. SQL can combine these datasets to analyse purchasing patterns.
A simple query might look like this:
SELECT product_name, SUM(quantity) AS units_sold
FROM sales
GROUP BY product_name
ORDER BY units_sold DESC;
This query summarises the number of units sold for each product, assuming the database contains the specified fields.
SQL becomes particularly useful when working with large datasets that are difficult to manage manually.
3. Power BI for Interactive Dashboards
Power BI helps analysts transform data into interactive reports and dashboards.
A business owner could use a dashboard to monitor:
Total sales.
Monthly revenue.
Best-selling products.
Sales performance by branch.
Stock movement.
Changes in customer demand.
For example, a business with branches in Nairobi and Thika could compare branch performance and identify products that sell differently across locations.
A useful dashboard should answer specific questions instead of displaying unnecessary charts.
4. Python for Data Analysis
Python supports more flexible analysis, automation and statistical work.
Libraries such as pandas help manipulate datasets, while NumPy supports numerical operations and Matplotlib supports visualisation.
Example: Analysing customer orders
Suppose an online business receives thousands of orders every month. Python could help clean inconsistent product names, calculate average order values and identify trends over time.
Once you understand the basics, you can use Python to automate repetitive analysis rather than repeating the same manual steps.
5. Statistics and Business Interpretation
Tools are only useful when the analyst understands what the results mean.
You should learn averages, percentages, distributions, sampling and basic statistical reasoning.
For example, if average sales increase from KSh 50,000 to KSh 60,000 per day, the increase is 20%.
However, you should investigate whether the increase is consistent, whether the number of transactions changed and whether the comparison covers equivalent periods.
Good analysts avoid presenting numbers without explaining their context.
6. Communication and Data Storytelling
An analyst must communicate findings to people who may not understand technical terms.
Instead of saying, "The dataset shows a positive month-over-month revenue variance," you might explain, "Revenue increased by 12% compared with the previous month, mainly because online orders increased."
Clear communication helps decision-makers understand what the evidence supports and what action they might consider.
Build a Practical Data Analytics Portfolio
Begin with a sales dataset and use Excel to clean it. Then use SQL to query the records, Python to explore trends and Power BI to present the findings.
Document the questions you investigated, the steps you followed and the limitations of your analysis.
This demonstrates your ability to work through the analytics process rather than simply use individual tools.
Start Learning at Dazu School of Tech
If you want to develop data analytics skills, ask Dazu School of Tech about available training options in Nairobi and Thika.
Confirm which tools are covered, the practical assignments involved and the experience expected before enrolment.
Nairobi: Cianda House, 4th Floor, Room 406B.
Thika: Witeithie House, 5th Floor, Room 529.
Phone/WhatsApp: 0722 922 454.
Website: https://www.dazu.ac.ke/
Frequently Asked Questions
1. Should I learn Excel or Python first?
Excel is a useful starting point for beginners. Python becomes increasingly valuable for automation, larger datasets and more advanced analysis.
2. Why is SQL important for data analysts?
SQL allows analysts to retrieve, filter and combine data stored in relational databases.
3. Is Power BI useful in Kenya?
Power BI can support reporting and business intelligence across sectors such as retail, finance, logistics and operations.
4. Can I learn data analytics without being a programmer?
Yes. You can begin with Excel and visualisation, then progressively learn SQL and Python.
5. What project can a beginner build?
A sales performance dashboard is an excellent starting project because it combines data cleaning, calculations, visualisation and business interpretation.
Related articles
 data . How to Become a Data Scientist in Kenya: Skills, Courses and Career Paths
 data Data Science Training in Nairobi: Advanced AI, Big Data and Real-World Data Science Projects
 data Data Science Training in Nairobi: Learn Machine Learning and Predictive Analytics
 data Data Science Training in Nairobi: Advanced Data Analytics, Power BI and Business Intelligence
 data Data Science Training in Nairobi: Master Python, SQL and Statistics for Data Analysis
 data Data Science Training in Nairobi: A Beginner’s Guide at Dazu School of Tech
 data Data Collection and Data Management in Data Science: Essential Skills for Making Smarter Decisions
 data Interested in Data Science? Learn Data Analysis and Visualization at Dazu Training Institute
You might also like
 security What is Cybersecurity? A Complete Guide for Beginners
Nov 16, 2026
 software development Software Engineering Course in Thika: Build Real Skills, Real Projects, Real Career Opportunities
Nov 13, 2026
 beauty el Nails, Acrylic Nails and Nail Art: Which Skills Should You Learn?
Nov 13, 2026
 beauty Beauty Skills You Can Learn and Turn Into a Profitable Business in Kenya
Nov 13, 2026
 beauty Manicure and Pedicure Course in Kenya: Everything You Need to Know
Nov 13, 2026
 beauty : How to Become a Professional Nail Technician in Kenya
Nov 13, 2026