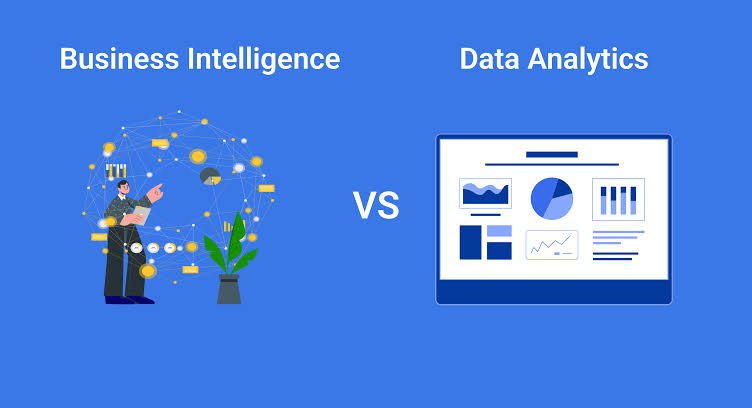
Progress into advanced data analytics with dashboards, data modelling, business intelligence and forecasting through practical learning at Dazu School of Tech
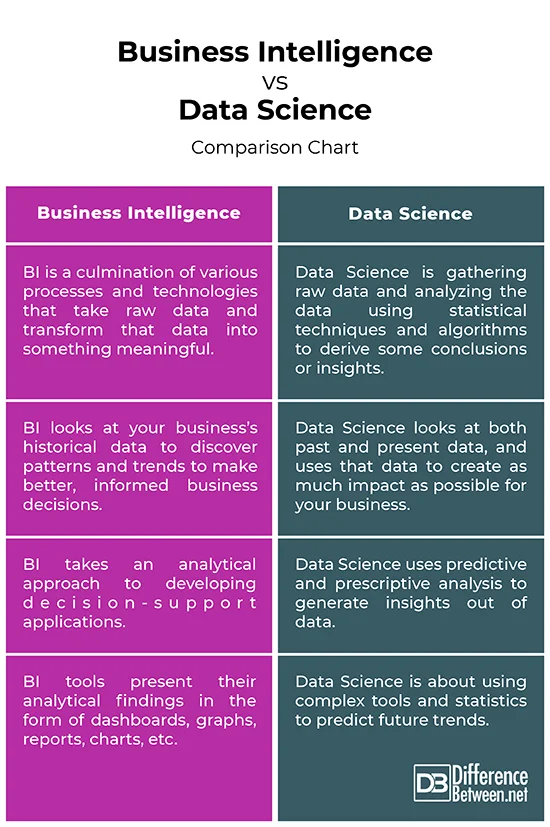
Data Science Training in Nairobi: Become a More Effective Data Analyst
A beginner data analyst learns how to organise data and produce reports. An experienced analyst goes further by designing reliable reporting systems, investigating business performance and helping decision-makers understand what actions the evidence supports.
If you are searching for data science training in Nairobi, understanding advanced analytics and business intelligence can help you develop beyond basic spreadsheet work.
1. What Is Business Intelligence?
Business intelligence involves collecting, organising and presenting information to help organisations monitor performance and make decisions.
It commonly involves databases, data modelling, reporting tools and business performance indicators.
For example, a supermarket chain with branches in Nairobi and Thika may need to compare sales, inventory, operating costs and customer demand.
A well-designed business intelligence system can bring this information together into a consistent reporting environment.
2. Build Better Power BI Dashboards
Power BI allows analysts to develop interactive reports using data from different sources.
Advanced dashboard development involves more than selecting colours and inserting charts.
You should understand:
Data transformation with Power Query.
Relationships between tables.
Data modelling.
Measures and calculations using DAX.
Filter context and interactive reporting.
Dashboard performance.
Appropriate access permissions.
Practical example: A retail performance dashboard
A useful dashboard could display total revenue, profit margin, sales by branch and product availability.
A manager could filter the report by month or branch to investigate changes in performance.
The dashboard should clearly define its metrics. For instance, revenue and profit are different measures, and they should not be treated as interchangeable.
3. Understand Data Modelling
Data modelling determines how information is organised and connected for analysis.
A common approach in business intelligence is a star schema, where a central fact table containing transactions connects to dimension tables such as products, customers, branches and dates.
This structure can make reporting easier to understand and improve consistency across calculations.
For example, a sales analysis should define how returns, discounts and taxes are handled before calculating revenue or profit.
Without clear definitions, different reports may produce conflicting results.
4. Measure Business Performance Correctly
Analysts often work with key performance indicators, commonly called KPIs.
Examples include:
Revenue growth.
Gross profit margin.
Customer retention.
Conversion rate.
Average transaction value.
Stock turnover.
Cost per acquisition.
Each KPI should have a clear definition, calculation method and reporting period.
For example, an online store may report a higher number of website visitors but fewer purchases. An analyst should investigate the conversion rate and the stages where potential customers leave the process.
5. Forecasting and Trend Analysis
Forecasting uses historical information and appropriate methods to estimate future outcomes.
Businesses may forecast product demand, customer activity or operating costs.
However, forecasts are estimates rather than guarantees.
Example: Forecasting agricultural demand
A supplier may examine historical orders, seasonal patterns and market conditions to estimate demand for agricultural products.
A reliable analysis should consider missing data, changing market conditions and the limitations of the chosen method.
Forecast accuracy should be measured by comparing predictions with actual outcomes.
6. Communicate Insights to Decision-Makers
Technical analysis is only part of the job. Analysts must explain the results clearly.
A useful report answers three questions:
What happened?
What evidence may explain it?
What action should be considered next?
For example, instead of presenting ten charts about sales, you could explain that one branch has experienced declining sales for three consecutive months and recommend investigating product availability, customer traffic and pricing.
The recommendation should reflect the evidence rather than speculation.
7. Build an Advanced Analytics Portfolio
Create a project using a realistic business dataset.
Clean the data, develop a suitable data model, define KPIs, create an interactive dashboard and write a short management report.
Include your assumptions, metric definitions and limitations.
This demonstrates that you can do more than produce attractive charts: you can structure information and communicate findings responsibly.
Study Data Analytics in Nairobi or Thika
Dazu School of Tech offers prospective learners an opportunity to enquire about technology training in Nairobi and Thika.
Ask whether the available data-related course includes Excel, SQL, Power BI, Python, data modelling and practical reporting projects.
Nairobi: Cianda House, 4th Floor, Room 406B.
Thika: Witeithie House, 5th Floor, Room 529.
Phone/WhatsApp: 0722 922 454.
Website: https://www.dazu.ac.ke/
Frequently Asked Questions
1. What is the difference between data analytics and business intelligence?
Data analytics is the broader process of examining data to answer questions. Business intelligence focuses on systems, reporting and insights used to monitor and manage organisational performance.
2. Is Power BI enough to become a data analyst?
Power BI is useful, but broader competence may require SQL, data cleaning, statistics, business knowledge and communication skills.
3. What is DAX?
DAX stands for Data Analysis Expressions. It is a formula language used in Power BI and related Microsoft data tools for calculations and measures.
4. What is a KPI dashboard?
It is a report that presents defined performance indicators so users can monitor progress and identify areas that need attention.
5. Why should analysts learn data modelling?
Data modelling helps organise information, define relationships and support accurate, consistent reporting.
Related articles
 data . How to Become a Data Scientist in Kenya: Skills, Courses and Career Paths
 data Data Science Training in Nairobi: Advanced AI, Big Data and Real-World Data Science Projects
 data Data Science Training in Nairobi: Learn Machine Learning and Predictive Analytics
 data Data Science Training in Nairobi: Master Python, SQL and Statistics for Data Analysis
 data Data Science Training in Nairobi: Learn Excel, SQL, Power BI and Python
 data Data Science Training in Nairobi: A Beginner’s Guide at Dazu School of Tech
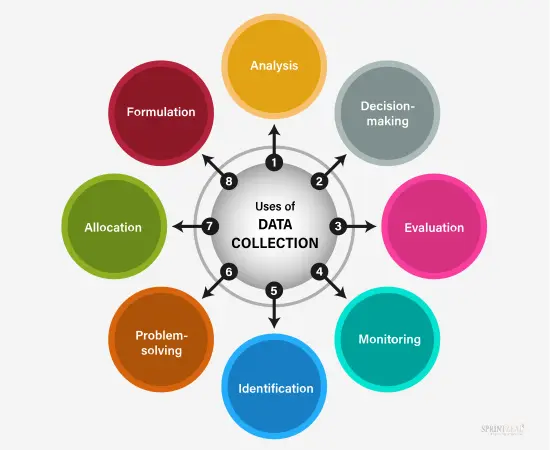 data Data Collection and Data Management in Data Science: Essential Skills for Making Smarter Decisions
 data Interested in Data Science? Learn Data Analysis and Visualization at Dazu Training Institute
You might also like
 security What is Cybersecurity? A Complete Guide for Beginners
Nov 16, 2026
 software development Software Engineering Course in Thika: Build Real Skills, Real Projects, Real Career Opportunities
Nov 13, 2026
 beauty el Nails, Acrylic Nails and Nail Art: Which Skills Should You Learn?
Nov 13, 2026
 beauty Beauty Skills You Can Learn and Turn Into a Profitable Business in Kenya
Nov 13, 2026
 beauty Manicure and Pedicure Course in Kenya: Everything You Need to Know
Nov 13, 2026
 beauty : How to Become a Professional Nail Technician in Kenya
Nov 13, 2026